Apr 2, 2025
Candlestick patterns are one of the most powerful tools used by traders to analyze price movements in the stock market.
For Indian traders, especially those active in NSE (National Stock Exchange), BSE (Bombay Stock Exchange), and F&O (Futures and Options) markets, understanding these patterns can provide a significant edge. Whether you're a day trader, swing trader, or a long-term investor, recognizing these patterns can help you make informed decisions.
In this comprehensive guide, we will break down 45 powerful candlestick patterns commonly used in the Indian markets with real-life examples and actionable strategies. Plus, you’re also getting access to this Free PDF guide to keep as a reference.
Let’s dive into the world of candlestick charts and discover how they can enhance your trading decisions.
A candlestick chart is a type of financial chart that visually represents price movements over a specific time period. Unlike line charts that only show closing prices, candlestick charts provide a detailed view by displaying four essential data points:
Open: The price at which the stock started trading during the time period
Close: The price at which the stock finished trading
High: The highest price during the time period
Low: The lowest price during the time period
These charts originated in Japan during the 18th century, where rice traders used them to analyze market behavior. Today, Indian traders widely use candlestick charts for analyzing stock trends and making informed trading decisions.
Components of a Candlestick
Each candlestick has two main parts:
Body: The rectangular section representing the difference between the opening and closing price.
Wicks: The thin lines extending above and below the body, representing the high and low prices of the period.
Types of Candlesticks
There are two broad categories of candlesticks:
Single candlesticks - Individual candles that convey key information about market behavior.
Pattern formations - Groups of candles that form patterns, predicting potential market reversals or continuations.
But at the same time, according to the price change, Candlesticks can be of two types.
Bullish Candle: A Bullish Candle forms when the closing price is higher than the opening price, usually represented in green or white.
Bearish Candle: A Bearish Candle forms when the closing price is lower than the opening price, typically shown in red or black.
This color distinction helps traders quickly assess market sentiment.
Candlestick patterns offer valuable insights into market sentiment and potential price movements, making them an essential tool for Indian traders.
Why you should use Candlestick patterns
Quick Insights: Candlesticks provide a clear visual representation of market behavior, helping traders make faster decisions.
Trend Identification: Recognizing bullish or bearish patterns can help traders ride trends effectively.
Reversal Signals: Patterns like the Morning Star or Bearish Engulfing can indicate potential trend reversals (Don’t worry. We will learn about them super soon)
Real world relevance of Candlestick patterns
In Indian markets, banking and IT stocks often show clear candlestick patterns due to high liquidity.
Intraday and Swing Traders commonly rely on patterns for short-term gains.
F&O traders track candlestick patterns to predict price breakouts and manage risks.
Now, with an understanding of why these patterns matter, let’s move on to the 45 most powerful candlestick patterns you should know.
You will also get a downloadable PDF of all these patterns at the end of this blog.
Bullish reversal patterns
1. Bullish engulfing
A large bullish candle completely engulfs the previous smaller bearish candle. It signifies strong buying pressure and is often seen at the bottom of a downtrend.
Example: After a series of red candles, a green bullish engulfing candle can indicate a reversal.
2. Morning star
A three-candle pattern that signals the end of a downtrend. The first candle is bearish, followed by a small-bodied candle, and concluded with a large bullish candle.
Example: A morning star forming at support levels may indicate a bullish reversal.

3. Tweezer bottom
Two consecutive candles with nearly identical lows. The first candle is bearish, followed by a bullish candle. This shows strong support and reversal.
Example: A tweezer bottom pattern at the bottom of a declining trend may suggest a reversal.

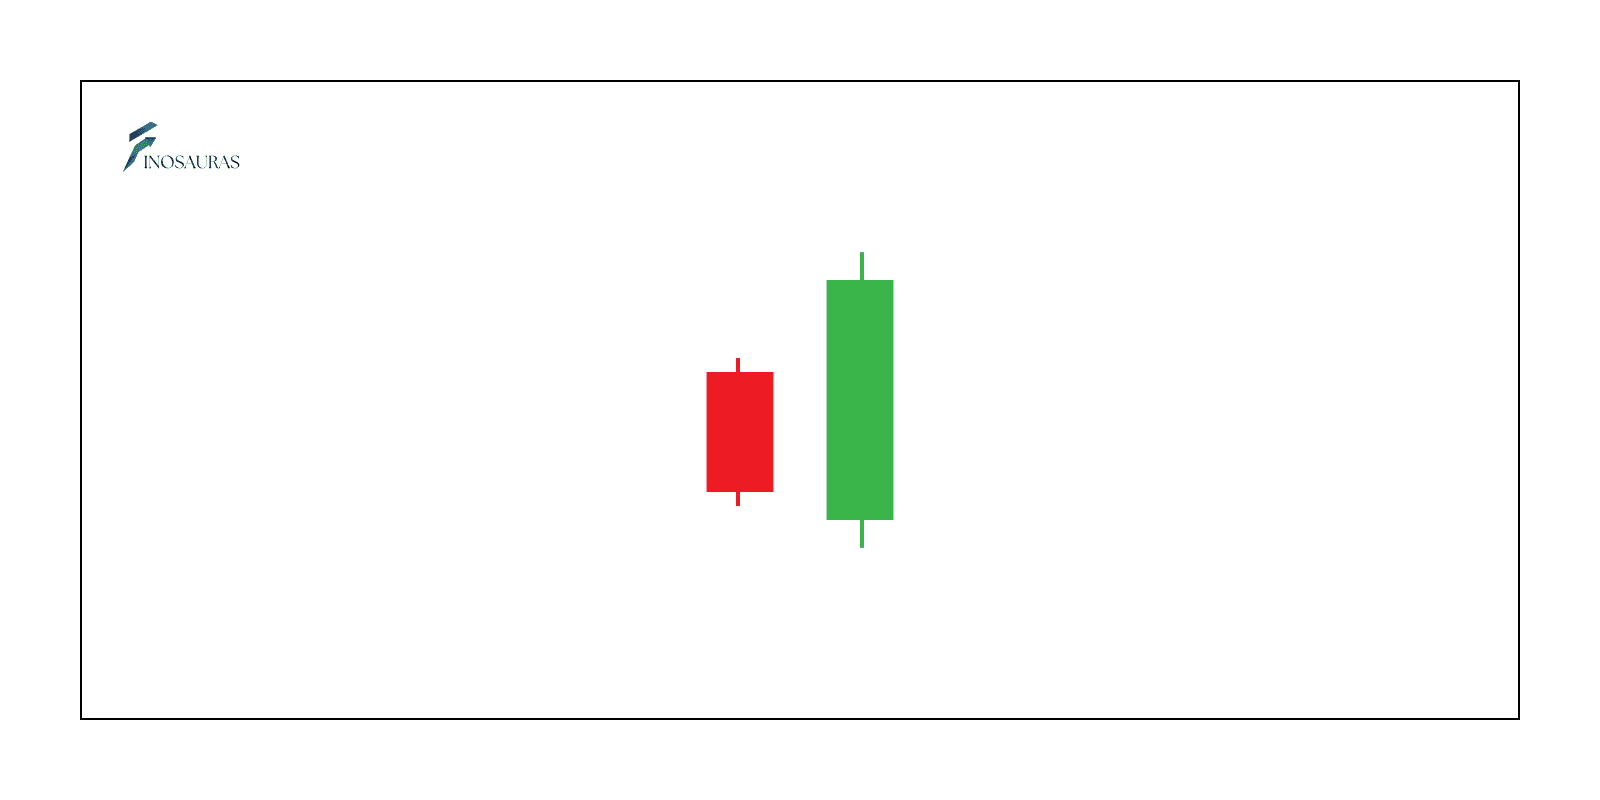
4. Piercing line
A bullish candle that opens lower but closes above the midpoint of the previous bearish candle. This indicates strong buying interest.
Example: After a downtrend, a piercing line may suggest bulls are regaining control.
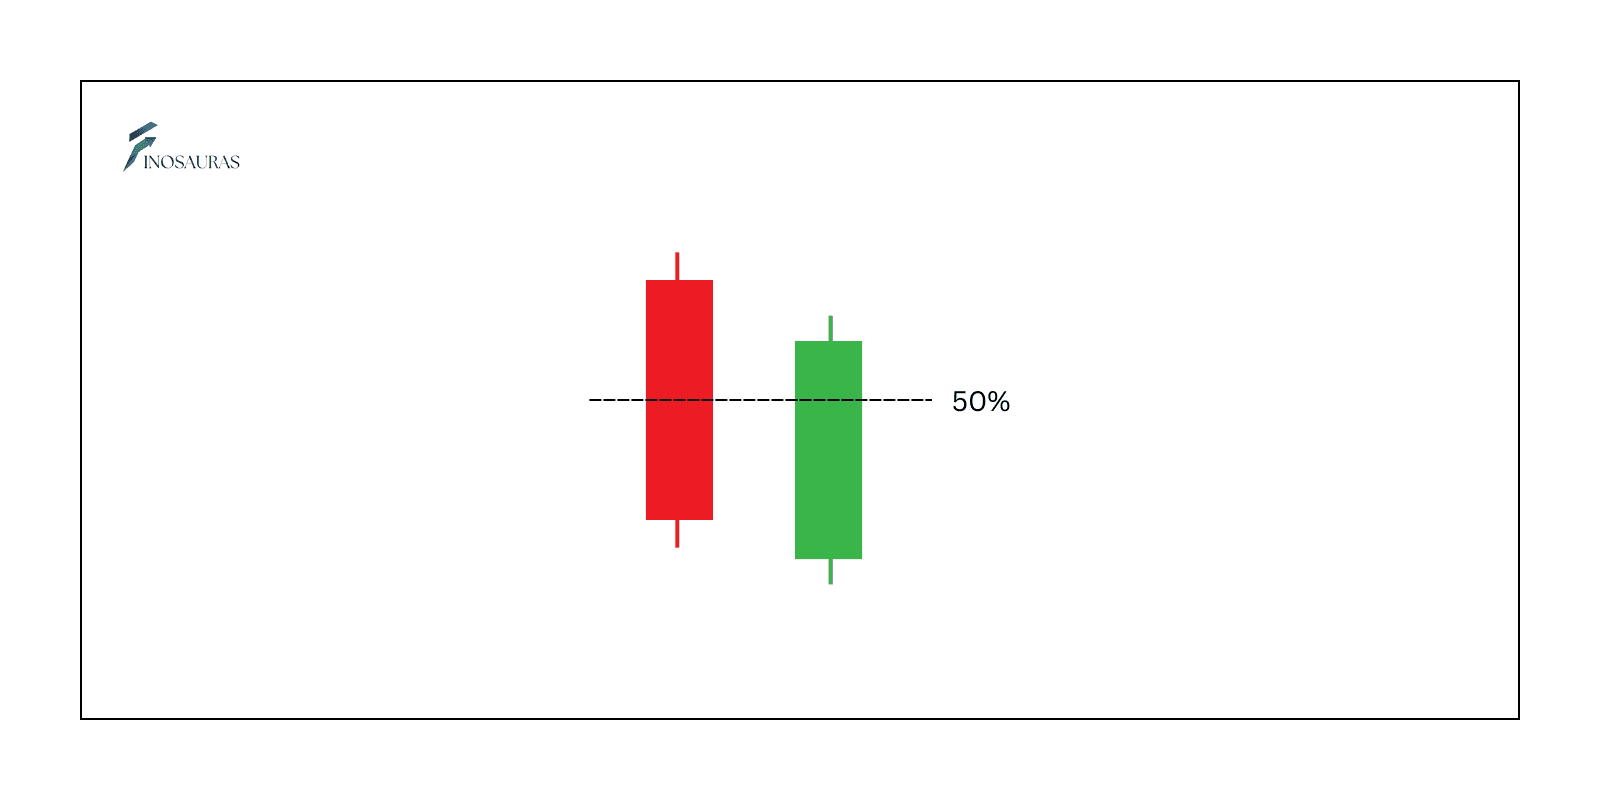
5. Bullish harami
A small bullish candle contained within the body of the previous large bearish candle. It suggests reduced selling momentum.
Example: In a downtrend, a bullish harami may signal potential reversal.
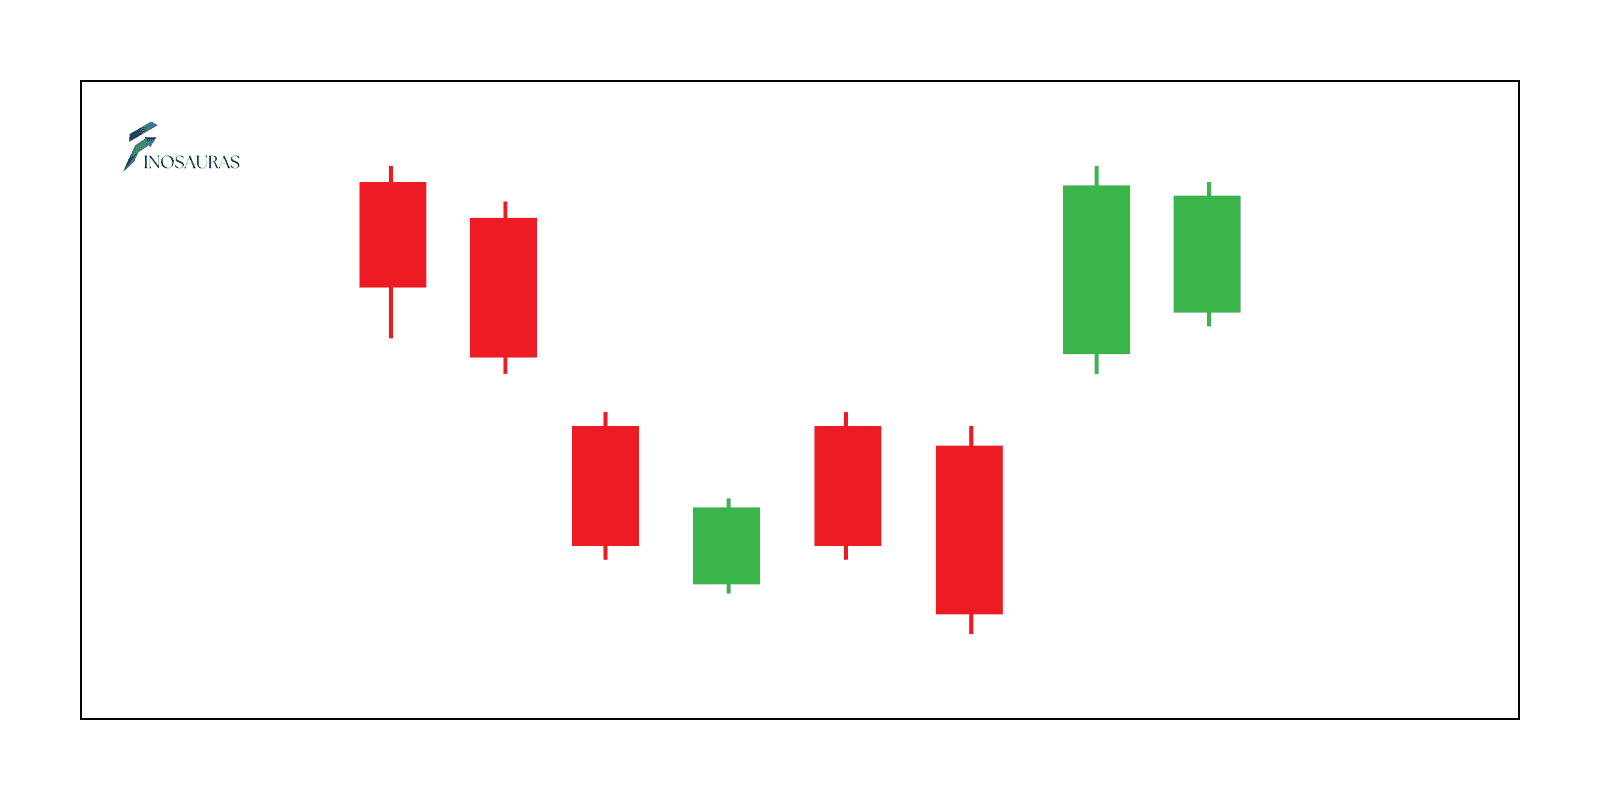
6. Abandoned baby (Bullish)
A gap-down followed by a doji and then a gap-up with a strong bullish candle. It indicates a sharp sentiment change.
Example: Abandoned baby bullish patterns often appear at the bottom of a strong downtrend.
7. Morning doji star
A variation of the morning star with a doji in the middle, highlighting indecision before the reversal.
Example: Appearing near support levels, it signals uncertainty before a reversal.

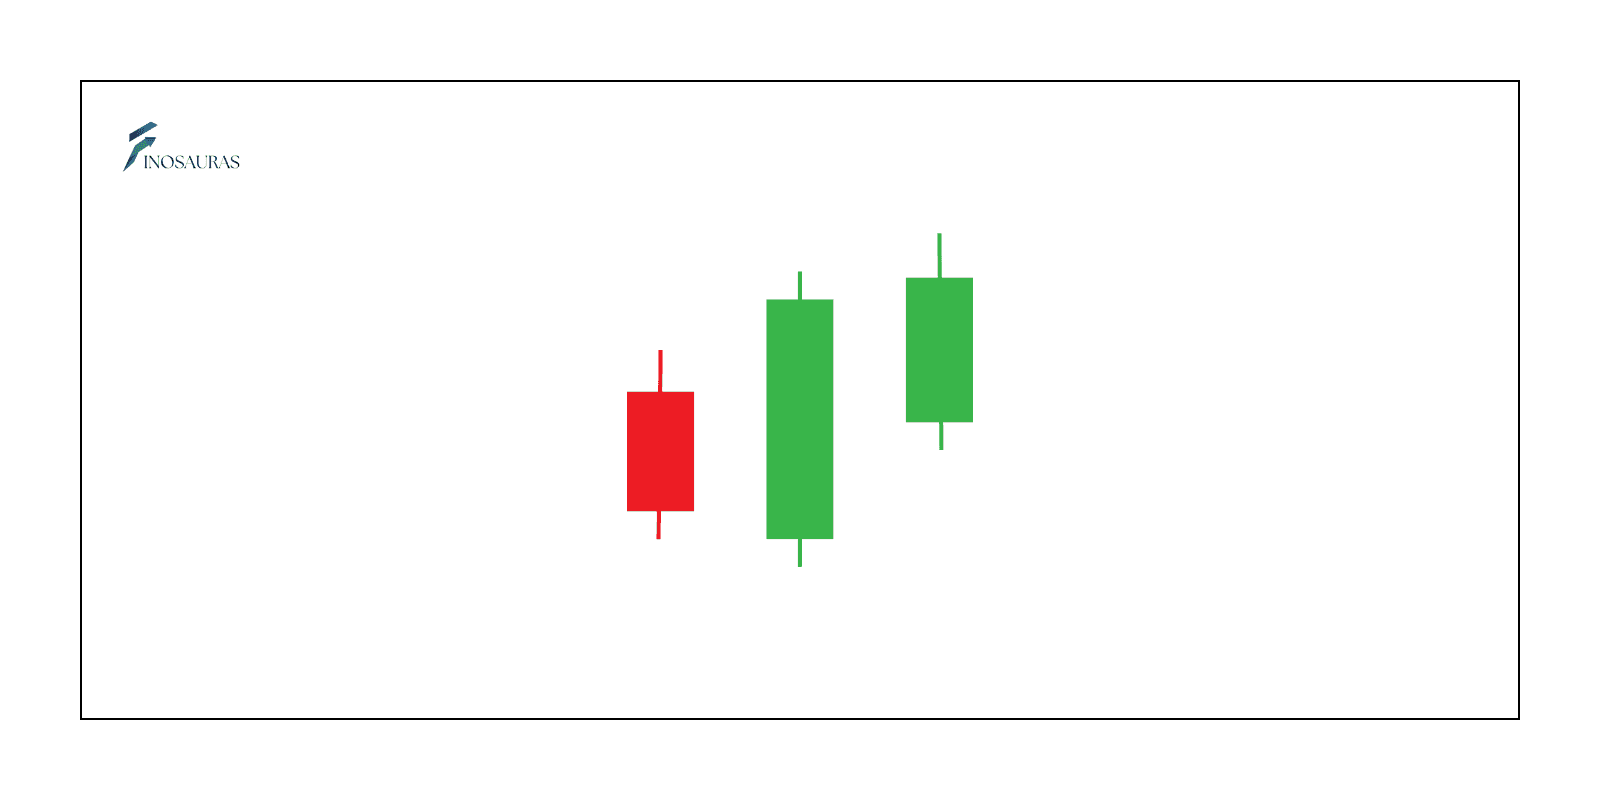
8. Three outside up
Three candles, starting with a bearish one, followed by a large bullish candle that engulfs it, and another bullish candle confirming the reversal.
Example: After a decline, this pattern signals strong buying pressure.
9. Bullish belt hold
A single bullish candlestick that opens at its low and closes near its high, suggesting a strong buying force.
Example: A bullish belt hold often forms in a trend reversal phase.
10. Kicking (Bullish)
Two strong candles with significant gaps, starting with a large bearish candle followed by a large bullish candle. This indicates a forceful reversal.
Example: Kicking patterns are seen after sudden market sentiment shifts.
Bearish reversal patterns
1. Bearish engulfing
A large bearish candle that completely engulfs the previous smaller bullish candle. This is a strong reversal signal.
Example: After a rally, a bearish engulfing candle may indicate selling pressure.
2. Shooting star
A small-bodied candle with a long upper wick, forming after an uptrend. It indicates rejection of higher prices and potential reversal.
Example: A shooting star at resistance levels warns of a downturn.
3. Evening star
A three-candle pattern signaling a reversal. It consists of a large bullish candle, followed by a small-bodied candle, and a large bearish candle.
Example: An evening star near resistance suggests sellers gaining control.
4. Dark cloud cover
A bearish candle that opens higher but closes below the midpoint of the previous bullish candle, indicating growing selling pressure.
Example: A dark cloud cover can appear after a bullish rally.
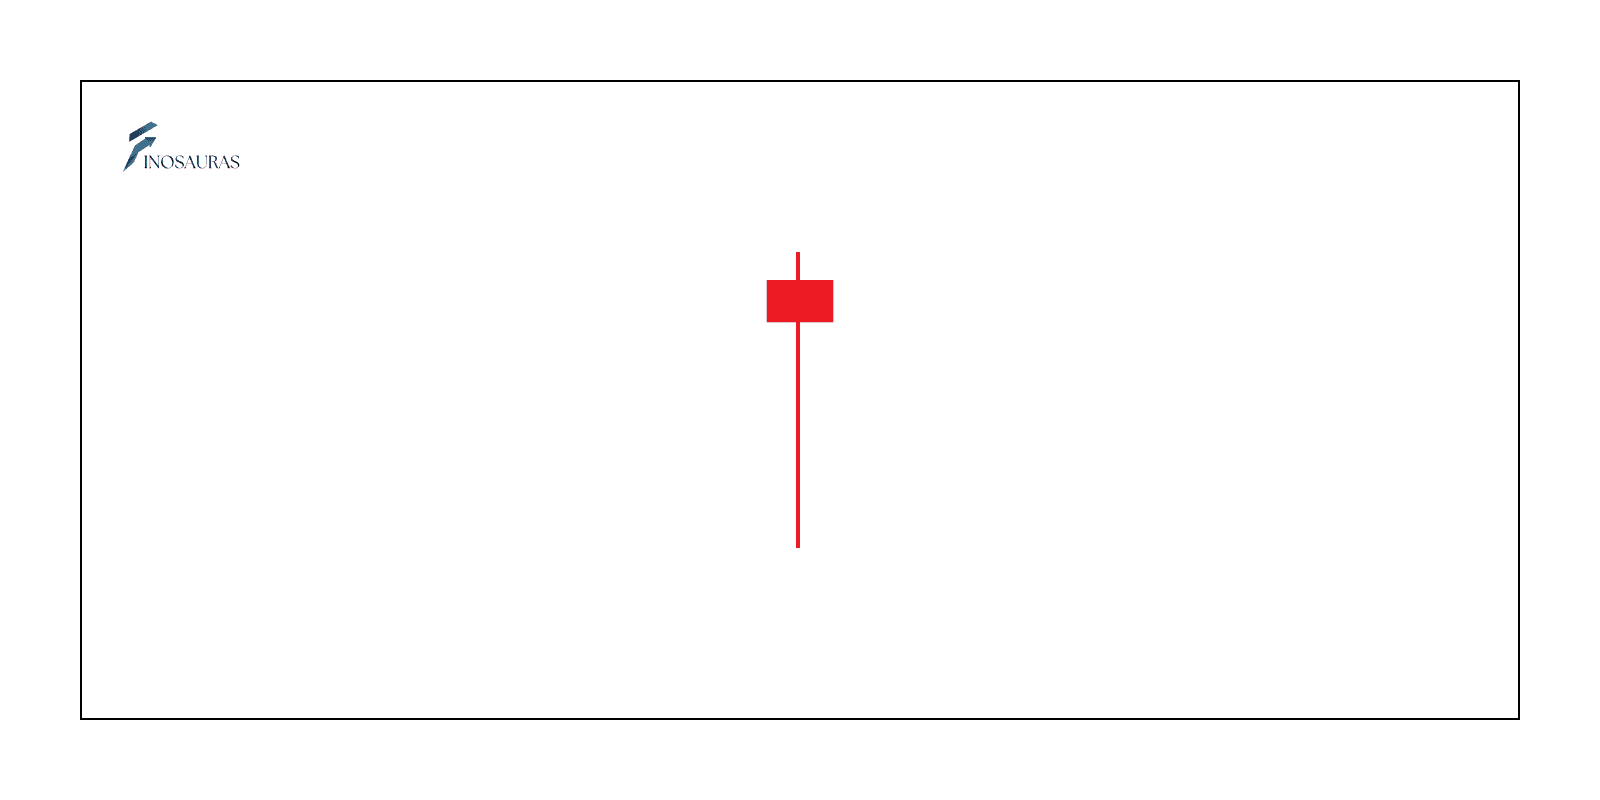
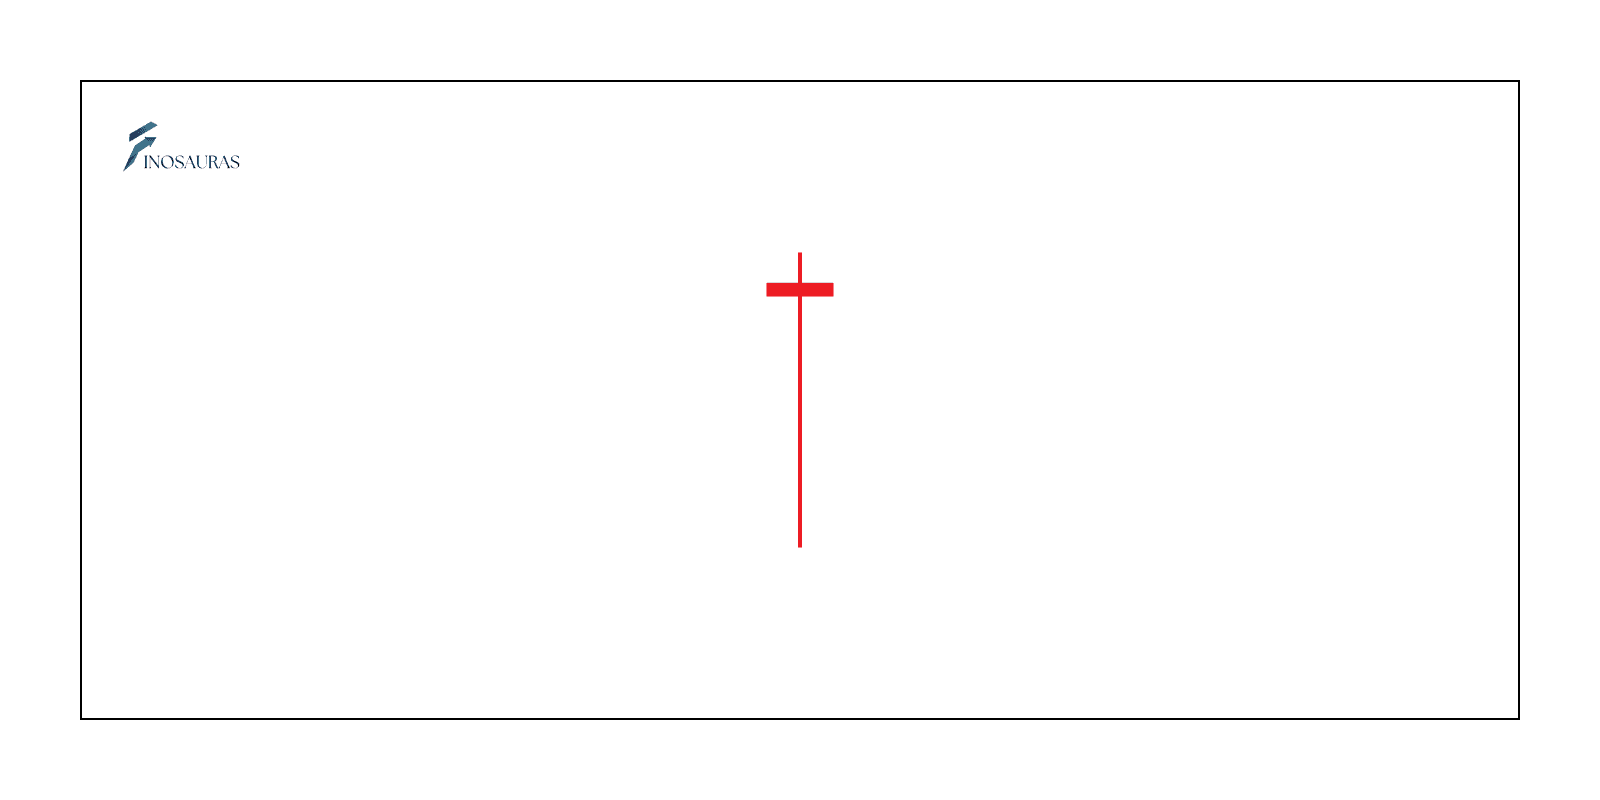
5. Hanging man
A small-bodied candle with a long lower wick, forming at the end of an uptrend. It suggests weakening buying momentum.
Example: A hanging man at the top of an uptrend warns of a reversal.
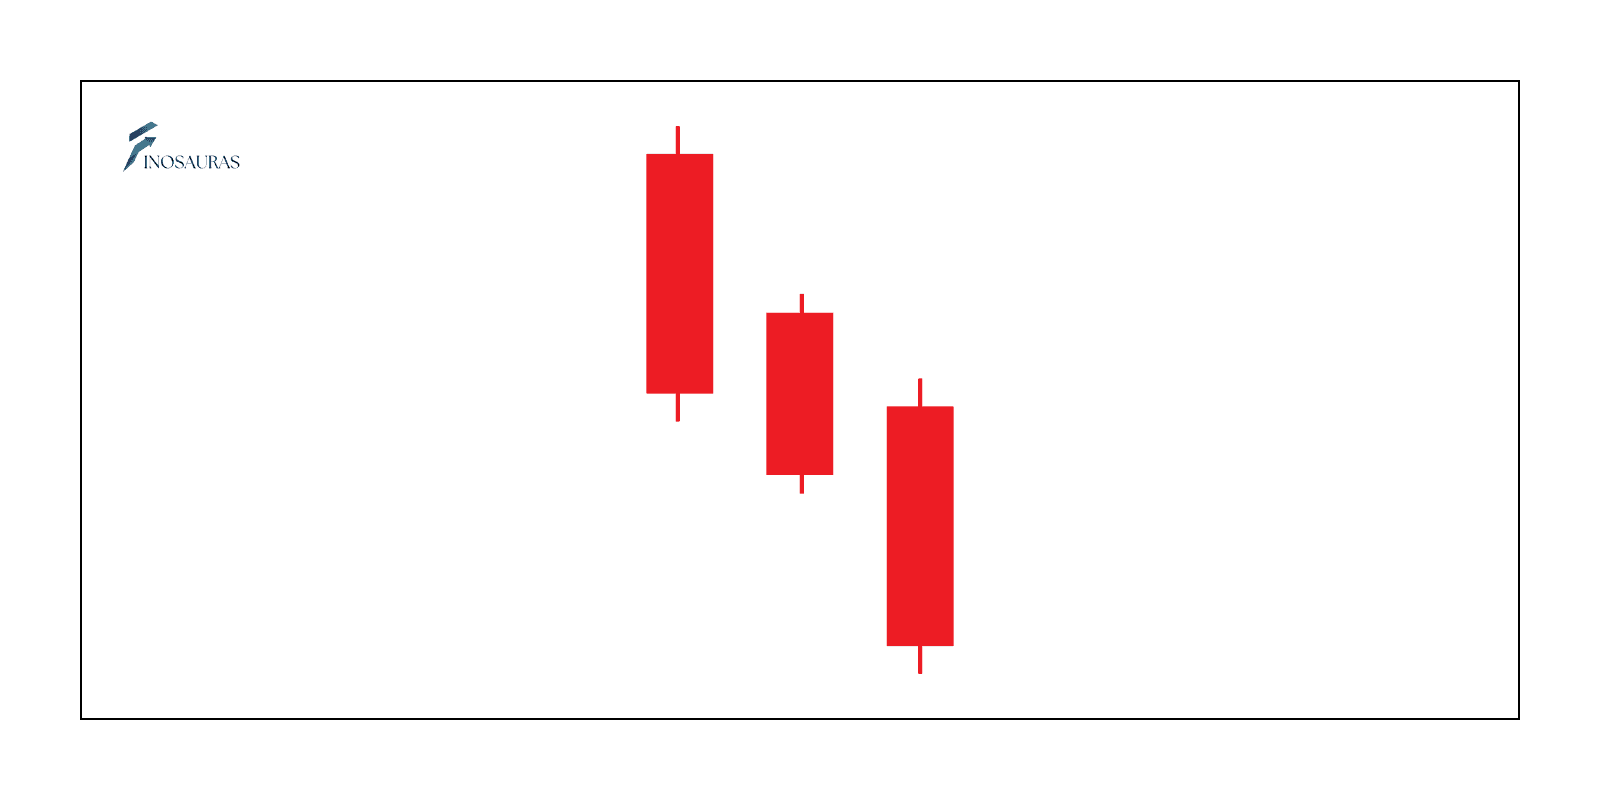
6. Three black crows
Three consecutive long bearish candles with little to no wicks. This indicates strong bearish momentum.
Example: After a strong uptrend, three black crows suggest a downtrend continuation.
7. Tweezer top
Two consecutive candles with nearly identical highs. The first is bullish, followed by a bearish candle. It reflects resistance and suggests reversal.
Example: Tweezer tops often appear near significant resistance levels.
8. Abandoned baby (Bearish)
A gap-up followed by a doji, then a gap-down with a strong bearish candle. It signals a sharp sentiment change.
Example: Abandoned baby patterns can indicate a swift reversal from bullish to bearish.

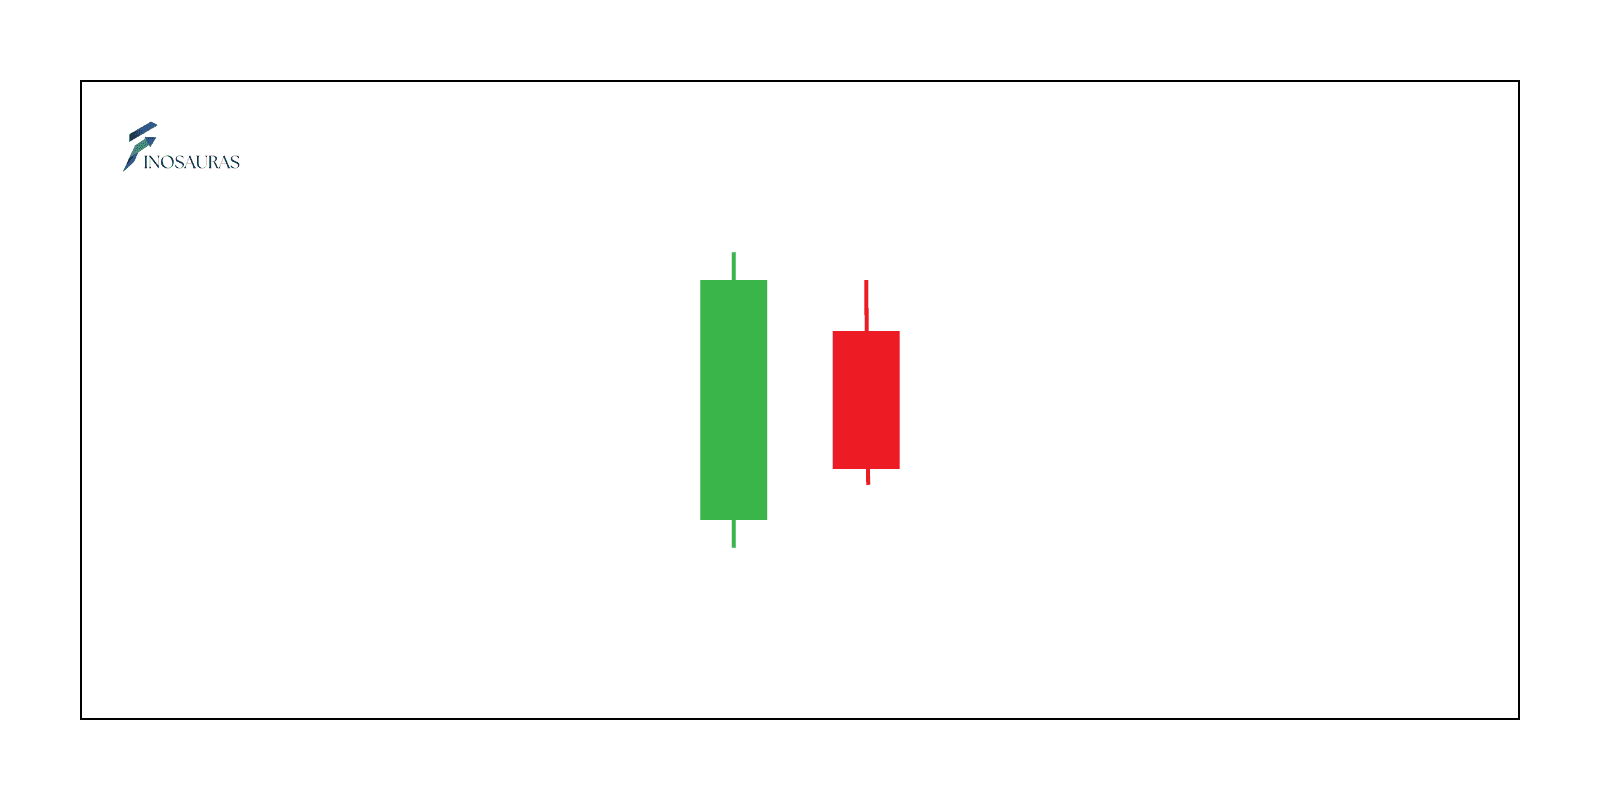
9. Bearish harami
A small bearish candle contained within the previous large bullish candle. It indicates reduced buying momentum.
Example: Bearish harami is a caution sign during uptrends.
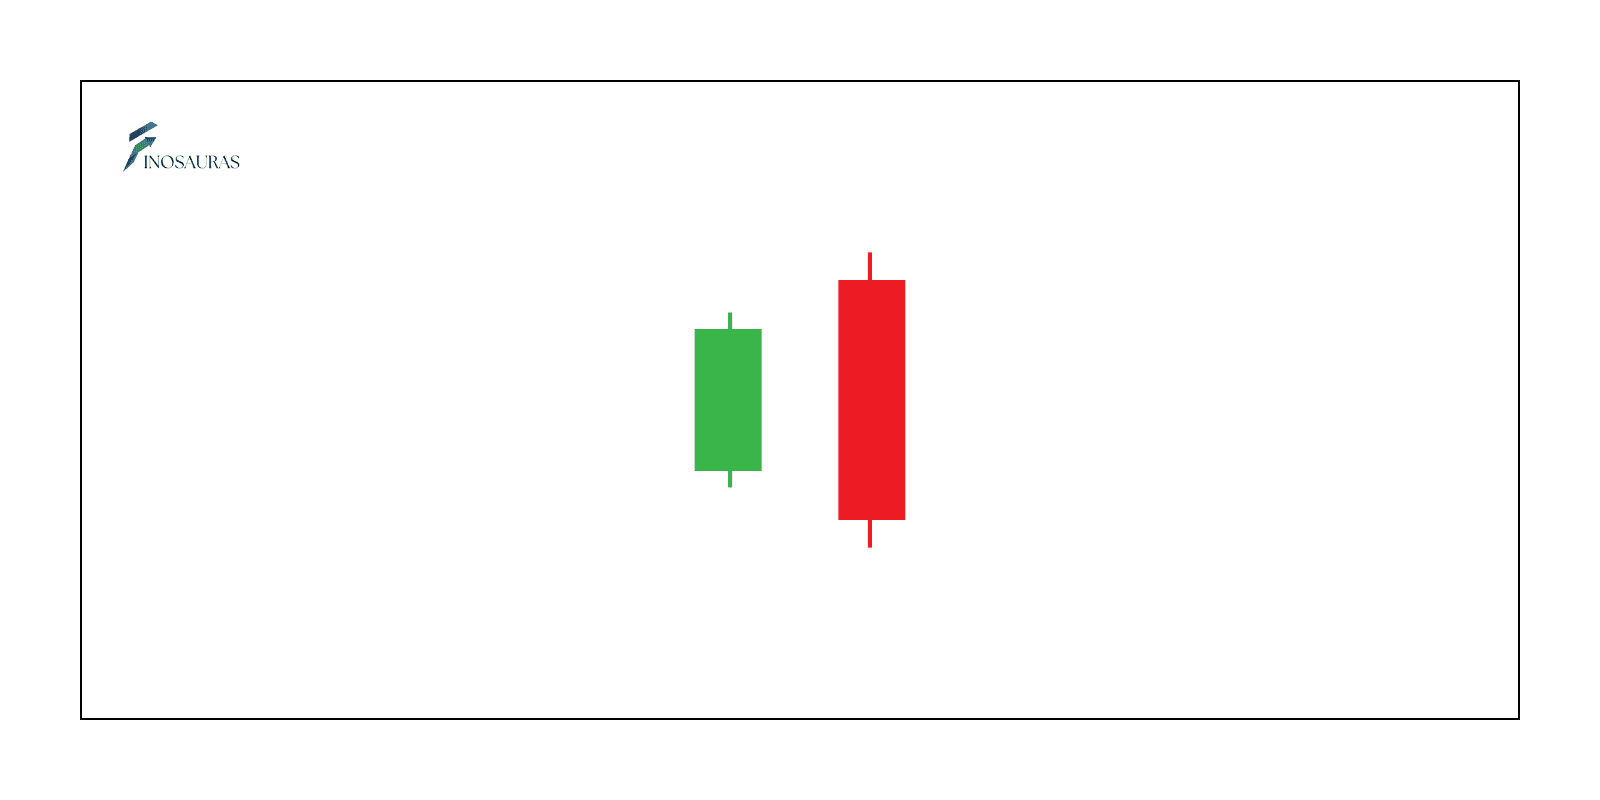
10. Bearish counterattack
A large bullish candle followed by a bearish candle that closes at the same level as the previous close. It reflects strong seller resistance.
Example: After a strong bullish day, a bearish counterattack can reverse sentiment.
Continuation patterns
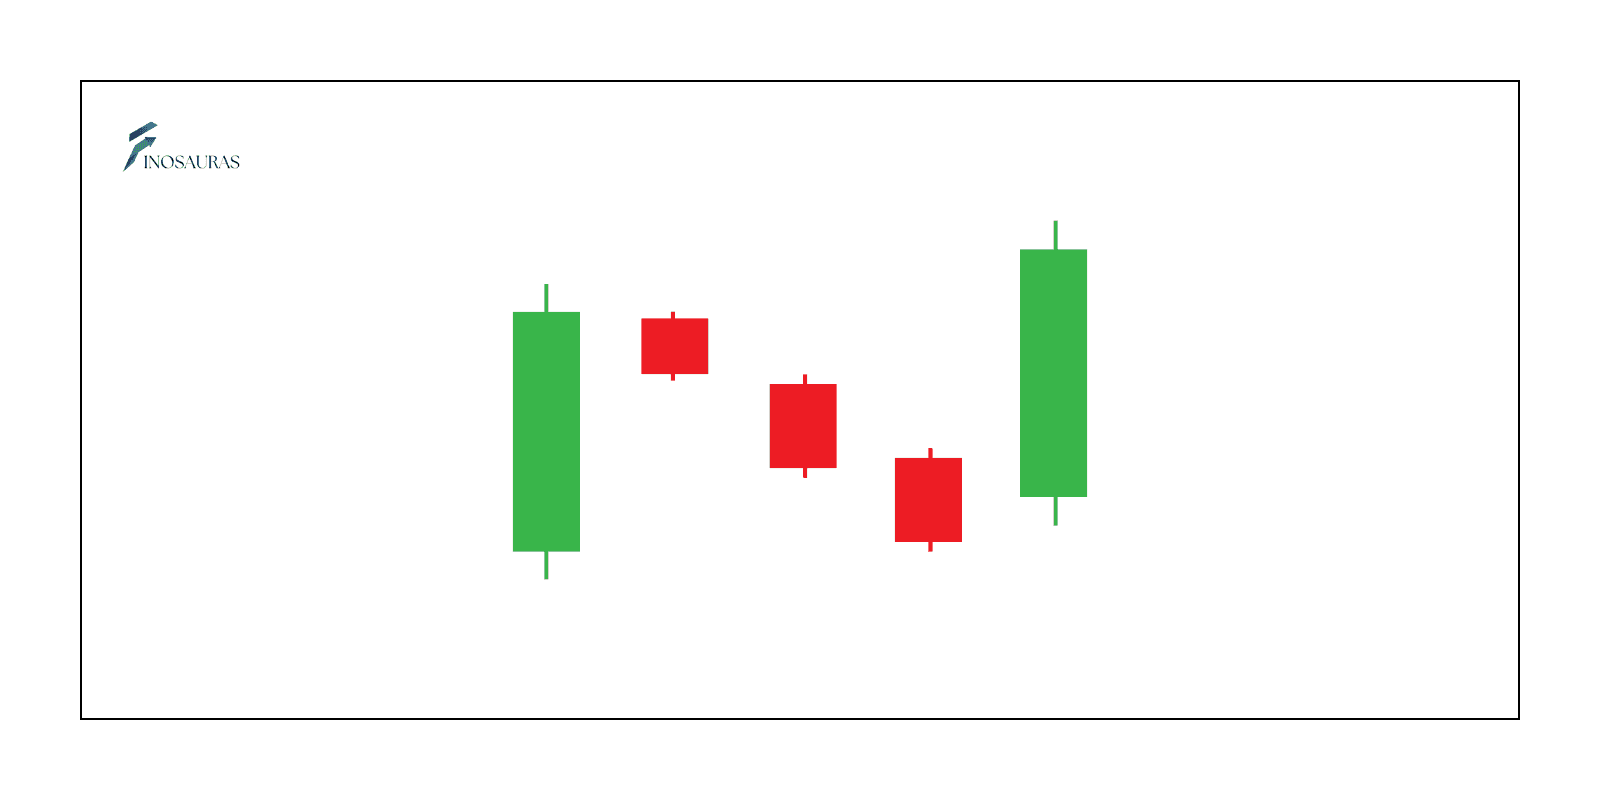
1. Rising three methods
A series of small bearish candles appear within the range of a preceding large bullish candle, followed by another strong bullish candle. It signifies a continuation of the uptrend.
Example: After a significant upward movement, a brief consolidation of small red candles within the previous green candle may indicate further bullish momentum.
2. Falling three methods
A large bearish candle is followed by a series of small bullish candles within its range, concluding with another strong bearish candle. This pattern signals a continuation of the downtrend.
Example: In a market downtrend, if small green candles form between two large red candles, the bearish momentum is likely to persist.
3. Bullish flag
A sharp upward price movement forms the flagpole, followed by a small rectangular consolidation (flag) that moves slightly downward or sideways. A breakout above the flag confirms bullish continuation.
Example: After a strong uptrend, a short period of consolidation may precede another surge in price.
4. Bearish flag
A steep decline in price creates a flagpole, followed by a small consolidation phase where the price moves upward or sideways. A breakdown below the flag confirms bearish continuation.
Example: In a market downtrend, a temporary rise forming a flag-like shape may precede further declines.
5. Bullish pennant
After a strong upward movement, a small symmetrical triangle or pennant forms, representing a consolidation. A breakout above the pennant suggests bullish continuation.
Example: Following a rapid price surge, a brief period of indecision may lead to another breakout in the same upward direction.
6. Bearish pennant
A sharp downward movement is followed by a small triangular consolidation. A breakdown below the pennant suggests a continuation of the bearish trend.
Example: After a strong price drop, a short consolidation phase may indicate further downside movement.
7. Ascending triangle
A horizontal resistance line forms at the top while the lows progressively get higher, creating a triangle shape. A breakout above the resistance level confirms bullish strength.
Example: Consistent higher lows pressing against a resistance level often suggest that buying pressure is increasing, leading to a breakout.
8. Descending triangle
A horizontal support line forms at the bottom while the highs keep declining, forming a descending triangle. A breakdown below the support level confirms bearish sentiment.
Example: Lower highs converging toward a flat support level may indicate increasing selling pressure, leading to a price drop.
9. Symmetrical triangle
Both the highs and lows converge to form a symmetrical triangle. A breakout in either direction signals the continuation of the prior trend.
Example: In a volatile market, a symmetrical triangle may indicate a period of consolidation before resuming the previous trend.
10. Rectangle pattern
A rectangular price range forms when the market moves sideways with parallel support and resistance levels. A breakout from the rectangle confirms the continuation or reversal of the trend.
Example: In a consolidation phase, multiple touches of both support and resistance suggest indecision before the price eventually breaks out.
Indecision Patterns
1. Doji
A candlestick with a very small body, indicating that the opening and closing prices are nearly the same. It reflects market indecision and often signals a potential reversal or continuation.
Example: After a strong uptrend, a Doji may suggest weakening bullish momentum and a possible reversal.

2. Long-legged doji
A variation of the Doji with long upper and lower wicks, showing significant volatility and indecision between buyers and sellers. It often appears before major market moves.
Example: In a sideways market, a Long-Legged Doji may signal upcoming volatility as neither side dominates.
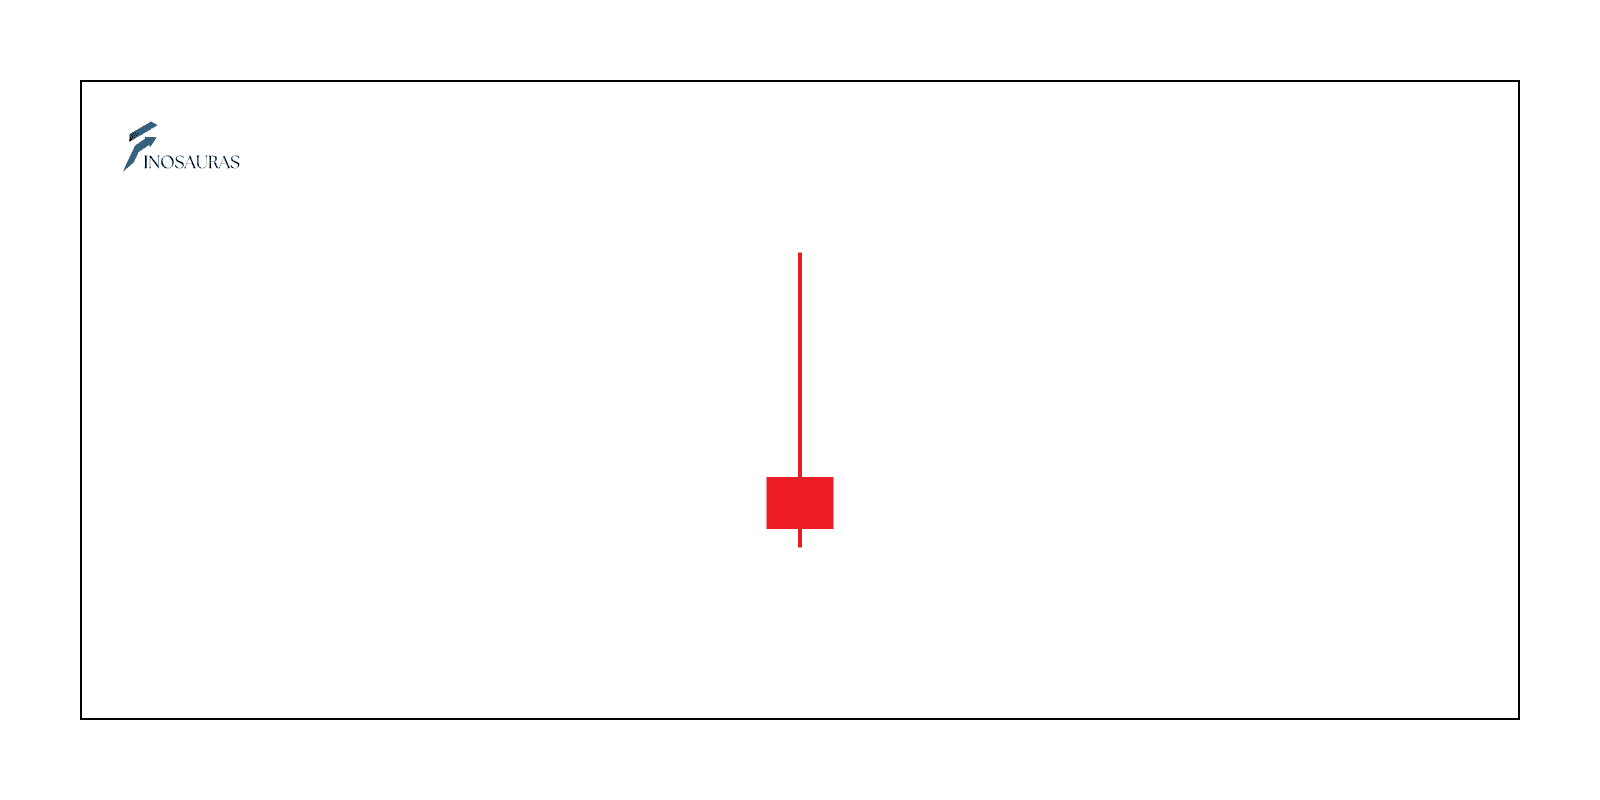
3. Dragonfly doji
A candlestick with a long lower wick and no upper wick, where the open, close, and high are almost the same. It suggests strong buying pressure and potential reversal, especially at the bottom of a downtrend.
Example: After a downtrend, a Dragonfly Doji forming near support can indicate a bullish reversal.
4. Gravestone doji
The inverse of a Dragonfly Doji, it has a long upper wick and no lower wick, with the open, close, and low nearly identical. It signals strong selling pressure and is often a bearish reversal indicator.
Example: Near a resistance level, a Gravestone Doji can suggest a potential trend reversal to the downside.

5. Spinning top
A candlestick with a small real body and long wicks on both sides, indicating indecision and a balance between buyers and sellers. It often signals a pause in the market trend.
Example: In an ongoing trend, a Spinning Top may suggest the momentum is weakening, leading to consolidation or reversal.
Neutral Patterns
1. Three line strike (Bullish)
A bullish continuation pattern where three consecutive bullish candles are followed by a larger bearish candle that engulfs the previous three. Despite the bearish fourth candle, it often signals a continuation of the uptrend.
Example: During an uptrend, a Three Line Strike may appear, suggesting temporary profit-taking before the bullish trend resumes.

2. Three line strike (Bearish)
A bearish continuation pattern with three consecutive bearish candles followed by a large bullish candle that engulfs the previous three. It often indicates further downside despite the sudden bullish move.
Example: In a downtrend, a Three Line Strike can suggest a minor pullback before the market continues downward.
3. Concealing baby swallow
A rare four-candle bearish pattern that typically occurs in downtrends. The first two candles are large bearish candles, followed by two smaller candles, with the fourth engulfing the third. It signals strong bearish momentum.
Example: In a falling market, a Concealing Baby Swallow suggests sellers are firmly in control, increasing the likelihood of further losses.

4. Mat hold pattern
A bullish continuation pattern with a strong bullish candle, followed by a series of smaller candles that slightly retrace but remain within the range of the first candle. It ends with another large bullish candle, confirming the uptrend.
Example: During an uptrend, a Mat Hold Pattern may indicate consolidation before another breakout higher.
5. On neck pattern
A bearish continuation pattern formed by a long bearish candle followed by a small bullish candle that closes near the previous candle’s low. It suggests weak buying pressure and further downside.
Example: In a strong downtrend, an On Neck Pattern signals a brief pause before the next wave of selling.

6. In neck pattern
Similar to the On Neck Pattern, but the second candle closes slightly above the previous candle’s low. It indicates hesitation from sellers but typically results in a continuation of the downtrend.
Example: After a sharp decline, an In Neck Pattern suggests weak bullish attempts that are likely to fail.
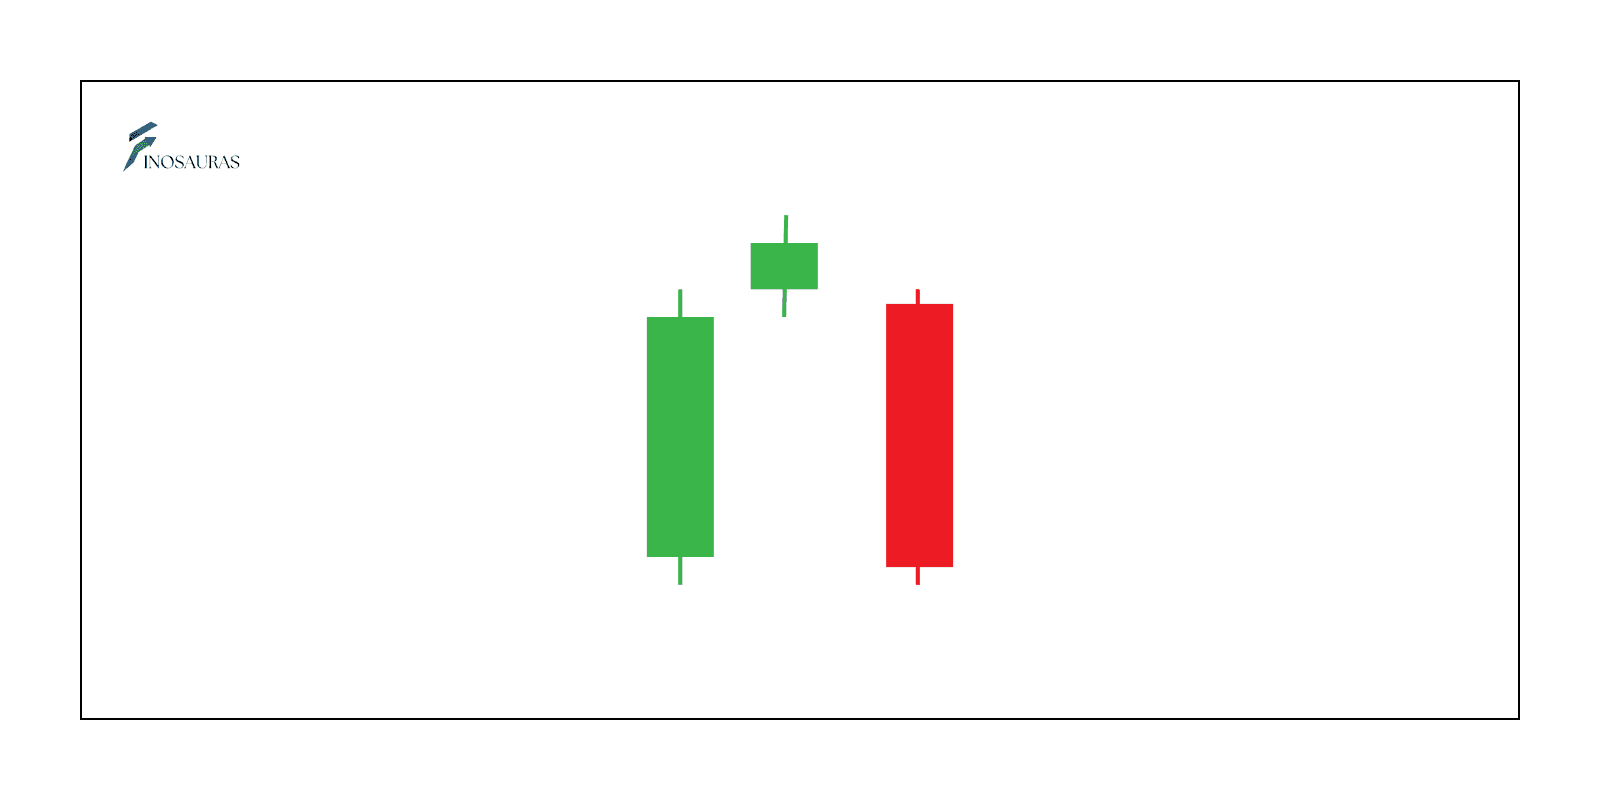
7. Thrusting pattern
A bearish continuation pattern where a bullish candle follows a large bearish one, closing within the lower half of the previous candle. It reflects weak bullish momentum and a likely continuation of the downtrend.
Example: During a bear market, a Thrusting Pattern may appear before another leg down.
8. Rising window
A bullish continuation pattern characterized by a gap up between two candles. It signals strong buying pressure and confidence in the uptrend.
Example: After a breakout from consolidation, a Rising Window often confirms further bullish momentum.

9. Falling window
The opposite of the Rising Window, this bearish continuation pattern occurs when a gap down separates two candles. It indicates strong selling pressure.
Example: In a market downturn, a Falling Window confirms bearish dominance and further downside.
10. Island reversal
A reversal pattern characterized by a gap followed by a series of candles, then another gap in the opposite direction. It signals a sharp change in market sentiment.
Example: After a prolonged downtrend, an Island Reversal with a gap up can indicate a bullish reversal.
Creating strategies using Candlestick patterns
Candlestick patterns are not only visual tools but also valuable for crafting trading strategies. Traders often use them to predict potential market moves and make informed trading decisions.
But remember that, just simply relying on candlestick patterns is not enough. Combining them with technical indicators enhances the accuracy of your decision.
RSI (Relative Strength Index): Identifies overbought or oversold conditions
Moving Averages: Confirms trend directions
MACD: Detects momentum shifts
Support and Resistance Levels: Provides insight into possible reversal zones
Finosauras Score: Check credibility & accuracy of top advisors
Example strategies
Reversal strategy: Use patterns like Bullish Engulfing or Evening Star to spot potential trend reversals
Breakout strategy: Identify breakouts using patterns like Ascending Triangle or Bullish Flag
Trend continuation strategy: Confirm ongoing trends with Rising Three Methods or Falling Three Methods
Finosauras verdict: Check Finosauras to see market sentiment about stocks & market
One such practical example
A Bullish Engulfing pattern with an RSI value below 30 signals a buying opportunity. Combining this with confirmation from moving averages increases accuracy.
Risk management using candlestick patterns
Set stop losses to limit potential losses
Evaluate market volatility before entering trades
Maintain a favorable risk-reward ratio for sustainable gains
Candlestick patterns are powerful tools in technical analysis, but misusing them or overrelying on them can lead to costly mistakes.
Traders often fall into common traps when interpreting patterns, especially without considering the broader market context.
Mistakes you should avoid
1. Over-reliance on Candlestick patterns
While candlestick patterns can provide valuable insights, relying solely on them without incorporating other technical indicators is risky. Indicators like RSI, MACD, or moving averages can add confirmation and reduce false signals.
Example: A bullish engulfing pattern may form, but if the RSI indicates overbought conditions, the likelihood of a sustained upward movement may be low.
2. Ignoring market context
Patterns work best when analyzed within a market context. Failing to account for trends, support and resistance levels, or overall market sentiment can lead to misinterpretation.
Example: A shooting star pattern forming at a significant resistance level is more likely to result in a reversal compared to the same pattern in the middle of a consolidation zone.
3. Lack of confirmation
Traders often act on a single candlestick pattern without waiting for confirmation. It’s essential to observe subsequent candles, volume spikes, or other indicators to validate the signal.
Example: A morning star pattern requires a third bullish candle to confirm the reversal. Acting prematurely may result in losses if the pattern fails.
4. Neglecting volume analysis
Volume is a key factor in validating candlestick patterns. Patterns with higher trading volume are more reliable than those with low volume.
Example: A bearish engulfing pattern with significantly higher volume than the previous bullish candle increases its credibility.
5. Misinterpreting patterns on different timeframes
Applying candlestick patterns across different timeframes without understanding their significance can lead to poor decisions. A pattern on a 5-minute chart may hold different implications than one on a daily chart.
Example: A hammer on a 1-hour chart might suggest a minor reversal, while on a daily chart, it could indicate a major trend change.
6. Ignoring false signals
Not all patterns lead to successful outcomes. Market noise can create misleading patterns, particularly in low-liquidity or volatile conditions.
Example: A gravestone doji in a choppy market may not hold significance, whereas the same pattern in a strong uptrend can suggest a reversal.
7. Failing to manage risk
Traders who rely on candlestick patterns without implementing proper stop-loss and risk management strategies expose themselves to excessive losses.
Example: After spotting a bullish flag, placing a stop-loss below the pattern's low can protect against unexpected reversals.
8. Emotional trading based on patterns
Emotions often lead traders to chase trades or hold onto losing positions. It’s essential to maintain discipline and stick to a well-defined trading plan.
Example: Seeing a bearish harami without confirming factors and panic-selling may lead to missed opportunities if the trend resumes upward.
For beginners, it’s advisable to practice identifying these patterns using demo accounts or historical charts. Over time, traders can develop the ability to read market behavior more effectively, making informed decisions with confidence.
As with any trading strategy, continuous learning and adaptation are crucial. Stay updated on market trends, test new strategies, and refine your understanding of candlestick patterns to maximize your trading potential.
With careful analysis and strategic planning, candlestick patterns can become a valuable addition to your trading toolkit. Happy trading!
Voila! You have successfully learnt all there is about Candlestick patterns. Get your Free PDF here!
Visit Finosauras to see performance of trades from expert social media advisors.